Dart diagnostic messages
Understanding error and warning messages from the Dart analyzer

Have you ever seen an error message and wondered what it means and what you should do about it? There might be more information available to help you answer those questions than you realize.
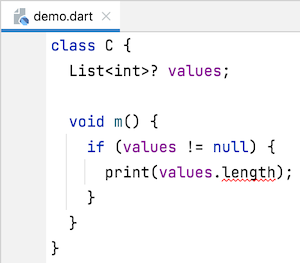
Let’s take a fairly common example. There’s a problem in the following code:
In IntelliJ IDEA, the message is visible in the Dart Analysis view:

In Visual Studio Code, the problem message appears in the Problems panel:

It seems odd that there’s a problem because we just checked
that values isn’t nullon the line
above.
The message tells us what’s wrong, but it doesn’t really
help us understand why the check wasn’t sufficient or how to
respond to the error. That extra information is actually
available; it just might not be obvious how to find it. The
rest of this article shows you how to find the location of
this extra information in the output of
IntelliJ IDEA,
Visual Studio Code, and the dart analyze command-line tool.
IntelliJ IDEA
#If you hover over the highlighted text you can get more information:
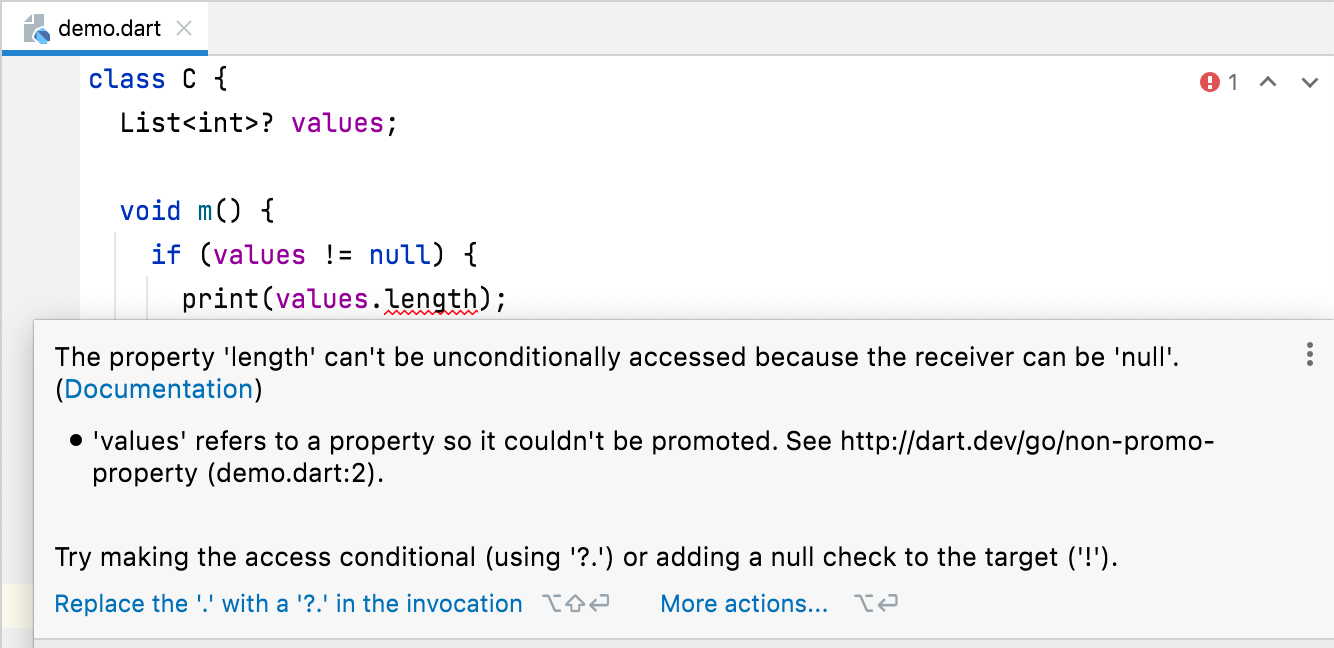
The hover includes the message we saw above (which we call the problem message), but it also includes other useful information:
-
A context message that explains why the null comparison wasn’t sufficient to promote the type of the property to be non-nullable
-
A correction message that describes some of the things you can do to correct the code
The context message includes the URL of additional documentation related to type promotion and tells you the line and file on which the field is defined. Unfortunately you can’t navigate to the context location from the hover, but you can from the Dart Analysis view.
Although the Dart Analysis view displays only the problem message, double-clicking the message navigates you to the text with the red squiggly underline where the problem is being reported. For other useful features, bring up the context menu:
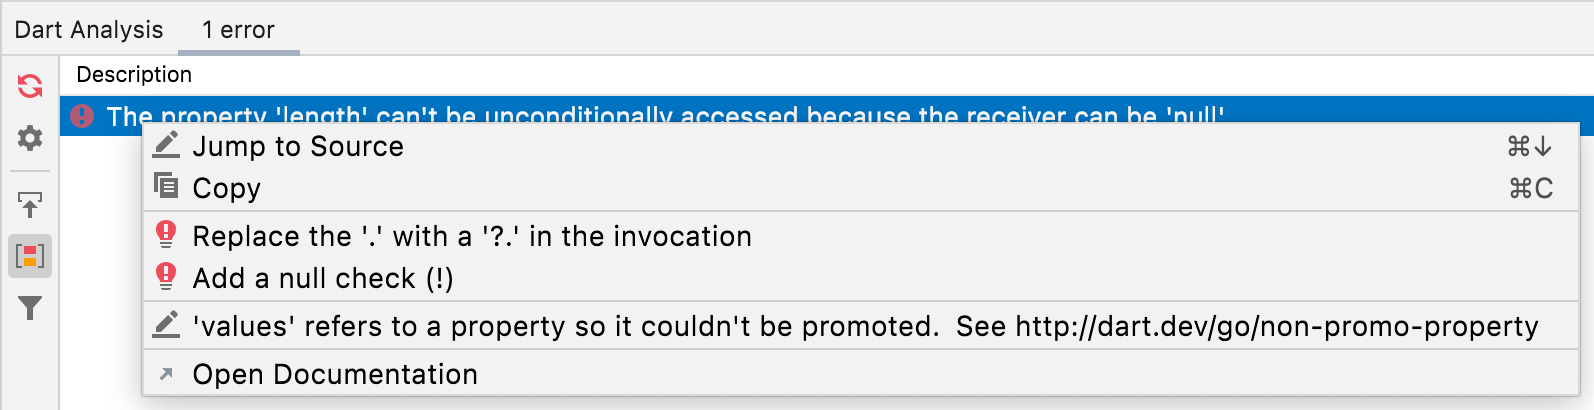
With the context menu, you can navigate to either the
location where the diagnostic was reported (using
Jump to Source, which works just like
double-clicking the problem message) or to the declaration
of values (using the menu item labeled by the
context message). Selecting
Open Documentation
opens the external documentation about the diagnostic.
Visual Studio Code
#In Visual Studio Code there are two ways to see the extra information. The first is to expand the entry in the Problems panel:

The first line is the message we saw before (which we call the problem message). Double-clicking either the first or second line navigates you to the text with the red squiggly underline where the problem is.
The second line is a correction message that describes some of the things you can do to correct the code. It also contains a link, labeled by the ID of the diagnostic, that opens external documentation about the diagnostic.
The third line is a context message that explains
why the null comparison wasn’t sufficient to promote the
type to be non-nullable. Double-clicking the context message
navigates you to the declaration of values. The
context message includes the URL of additional documentation
related to type promotion.
You can also see this information by hovering over the highlighted text, which causes hover text to be opened:
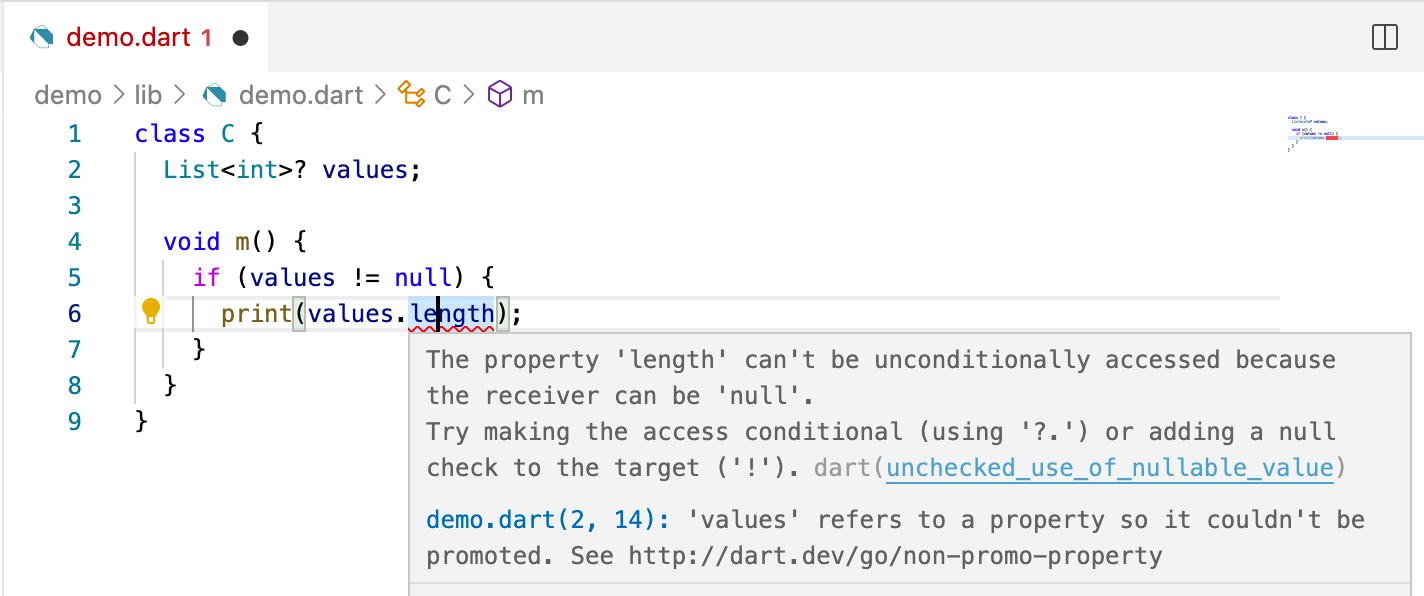
The hover text contains the same information as the Problems
panel. It contains a link to take you to the external
documentation and another link to navigate to the
declaration of
values.
dart analyze
#
The command-line analyzer dart analyze can
display the same information as the IDEs, but you need to
use the--verboseflag to see all of it.

Summary
#I hope this article helps you more easily find the information you need to understand the analyzer’s diagnostics.
If you find diagnostics that are still hard to understand — because the message isn’t clear, it needs a context message to help you find other related code locations, or the documentation isn’t complete enough — please let us know by creating a dart-lang/sdk issue. We’re always interested in improving the tools.
More from Dart

History of JS interop in Dart
Support for Wasm just landed in the current Flutter beta, thanks to an exciting JavaScript interop milestone reached in Dart 3.3. To…

Dart DevTools: Analyzing application performance with the CPU Profiler
Whether you’re a backend developer writing a command line tool using Dart, or a UX engineer building applications with Flutter, program performance is critical to the success of your project. Command line tools should minimize latency and apps should be responsive and snappy with no dropped frames. As developers, we try our best to write performant code but sometimes it’s not clear why our code isn’t performing as well as we would expect.